Attribution:
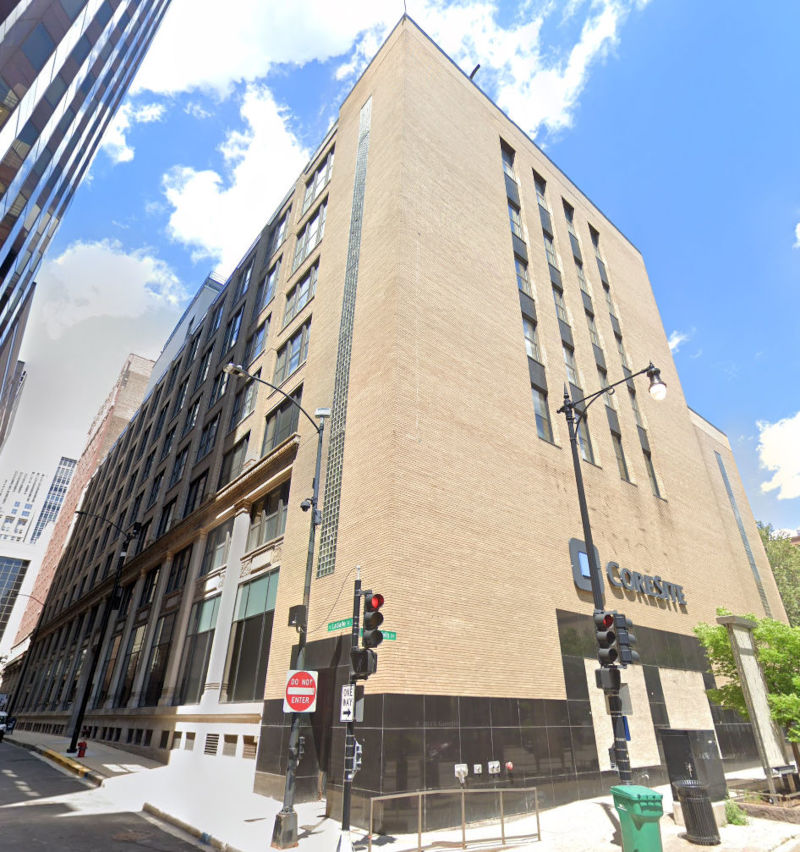
© Google 2023
Image Source
 . Cropped from original.
Building Info
- Square Footage
- 160,000 sqft
 Higher than 58% of all buildings1.2x median130,550 sqft1.0x median Data Center160,000 sqft
 - Built
- 1919
- Primary Property Type
- Data Center
- Community Area
- Loop
-
Chicago Energy Rating
- 4.0 / 4
-
Energy Star Score
- 94 / 100
- Owner
Emissions & Energy Information for 2021
- Greenhouse Gas Intensity
- 119.5 kg CO2e / sqft
 #2 Highest in Chicago* 🚨#1 Highest of Data Centers 🚨18x median6.5 kg CO2e / sqft1.2x median Data Center101.9 kg CO2e / sqft
 - Total Greenhouse Gas Emissions
- 19,114.5 metric tons CO2 eq.#21 Highest in Chicago* 🚩#1 Highest of Data Centers 🚨22x median873.9 metric tons CO2 eq.1.0x median Data Center18,871.3 metric tons CO2 eq.
- Source Energy Usage Intensity
- 2,342 kBtu / sqft#2 Highest in Chicago* 🚨#1 Highest of Data Centers 🚨18x median126.8 kBtu / sqft1.2x median Data Center1,997.8 kBtu / sqft
- Site Energy Usage Intensity
- 836.4 kBtu / sqft#7 Highest in Chicago* 🚨#1 Highest of Data Centers 🚨11x median73.6 kBtu / sqft1.2x median Data Center717.5 kBtu / sqft
- Natural Gas Use
- 0 kBtu
 #1 Lowest of Data Centers 🏆Lower than 97% of all buildingsMedian Chicago Building5,147,647.2 kBtuThis Building Didn't Burn Any Natural Gas! 🎉
This building burned no natural gas on-site and isn't connected to a district heating system, meaning it's fully electric!
- Electricity Use
- 133,830,104.3 kBtuEst. Electric Bill: $5,609,000 for 2021**#13 Highest in Chicago* 🚩#1 Highest of Data Centers 🚨37x median3,656,138.8 kBtu1.0x median Data Center131,693,953.5 kBtu
* Note on Rankings: Rankings and medians are among included buildings, which are those who reported under the Chicago Energy Benchmarking Ordinance for the year 2021, which only applies to buildings over 50,000 square feet.
** Note on Bill Estimates:
Estimates for gas and electric bills are based on average electric and gas retail
prices for Chicago in 2021 and are rounded. We expect large buildings
would negotiate lower rates with utilities, but these estimates serve as an upper bound of
cost and help understand the volume of energy a building is used by comparing it to your own
energy bills!
See our
Chicago Gas & Electric Costs Source
for the original statistics.
Data Source:
Chicago Energy Benchmarking Data
What Should We Do About This?
Practically every building has room to improve with energy efficiency upgrades like insulation, switching to ENERGY STAR rated appliances, and more, but for any buildings with large natural gas use, we recommend one thing: electrify!
In other words,
buildings should look to move all on-site uses of fossil fuels (including
space heating, water heating, and cooking) to electrically powered systems like
industrial grade heat pumps, heat pump water heaters, and induction stoves. With Illinois'
current electric supply, just using the same amount of energy from electricity, rather
than natural gas (aka methane) will dramatically reduce greenhouse gas emissions.
This is because Illinois' grid in 2020 was already 67% carbon-free
(see Illinois - Power | DecarbMyState ).
This has already been done across the country with a variety of buildings, large and
small, like the
Hotel Marcel
.
You can help make this a reality by talking to building owners and letting them know that a building's emissions are important to you, and that you want to see their building become fully electric and stop emitting greenhouse gases. Particularly for buildings you have a financial stake in (like your university, work, condo building, or apartment building) your voice in concert with your fellow building users can have a huge impact.
Additional Resources
See some additional resources on improving energy efficiency and understanding this data: